Blinkql
An in-browser SQL workbench that queries CSV, Parquet and JSON files on your own machine, with no upload. Every performance change is benchmarked and published.
- Role
- Creator and maintainer
- When
- October 2026 – now
- Stack
- TypeScript, React, DuckDB-WASM, Apache Arrow, Web Workers, TanStack Virtual, ECharts, OPFS
The problem
A lot of business data lives in exports: CSV files from ERP and HR systems, application logs. When the built-in reports don’t answer a question, people reach for a spreadsheet, which stops at 1,048,576 rows; a cloud BI tool, which means uploading data that often isn’t allowed to leave the company; or a Python notebook, which many of the people closest to the data can’t use.
Blinkql is a web page instead. Files are read by the browser and never uploaded, because there is no backend. The engine, DuckDB compiled to WebAssembly, is fast. The hard part is keeping the interface responsive while it loads, moves and draws millions of rows.
What I did
- Kept the main thread for the interface: the engine runs in a Web Worker, results arrive as Apache Arrow batches, and they live in a store outside React, so large results never pass through React state.
- Built the benchmark harness before optimising: deterministic datasets from 100,000 to 10 million rows, fixed scenarios, three warm-up and ten measured runs, medians and p95, and raw results committed with the commit they came from. CI runs a benchmark smoke test on every pull request and fails if a budget regresses.
- Ran 13 experiments, each with a hypothesis and a published before-and-after write-up: reading cells straight from Arrow instead of building row objects, virtualising the grid, streaming the first rows, cancelling superseded queries, caching the engine, and loading the editor and charts on demand.
- Rejected two ideas the numbers didn’t support: a multithreaded engine, faster on some aggregations but blocked by extension, file-access and crash issues; and a canvas-rendered grid, which didn’t fix the drag scrolling it was meant to fix and cost memory and accessibility.
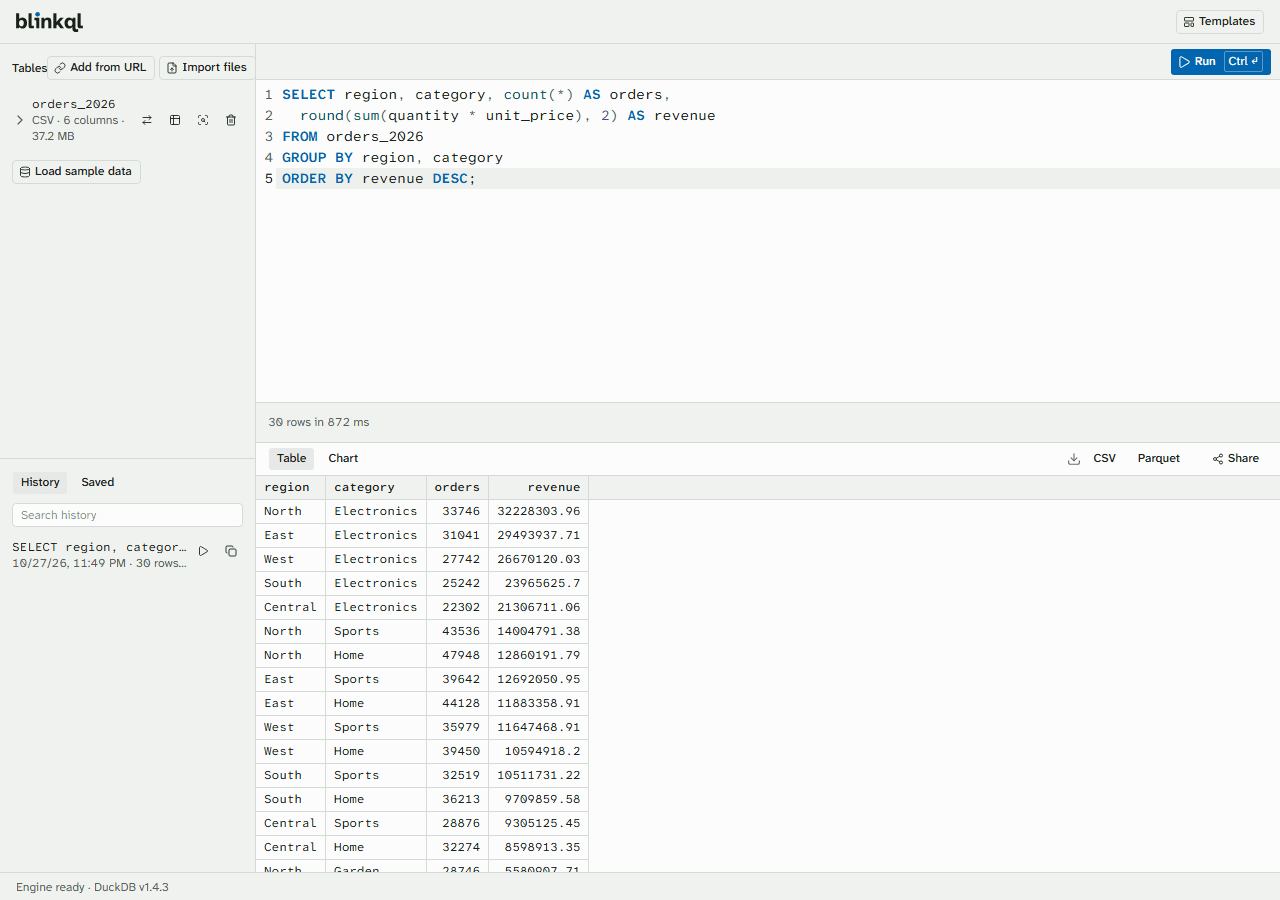
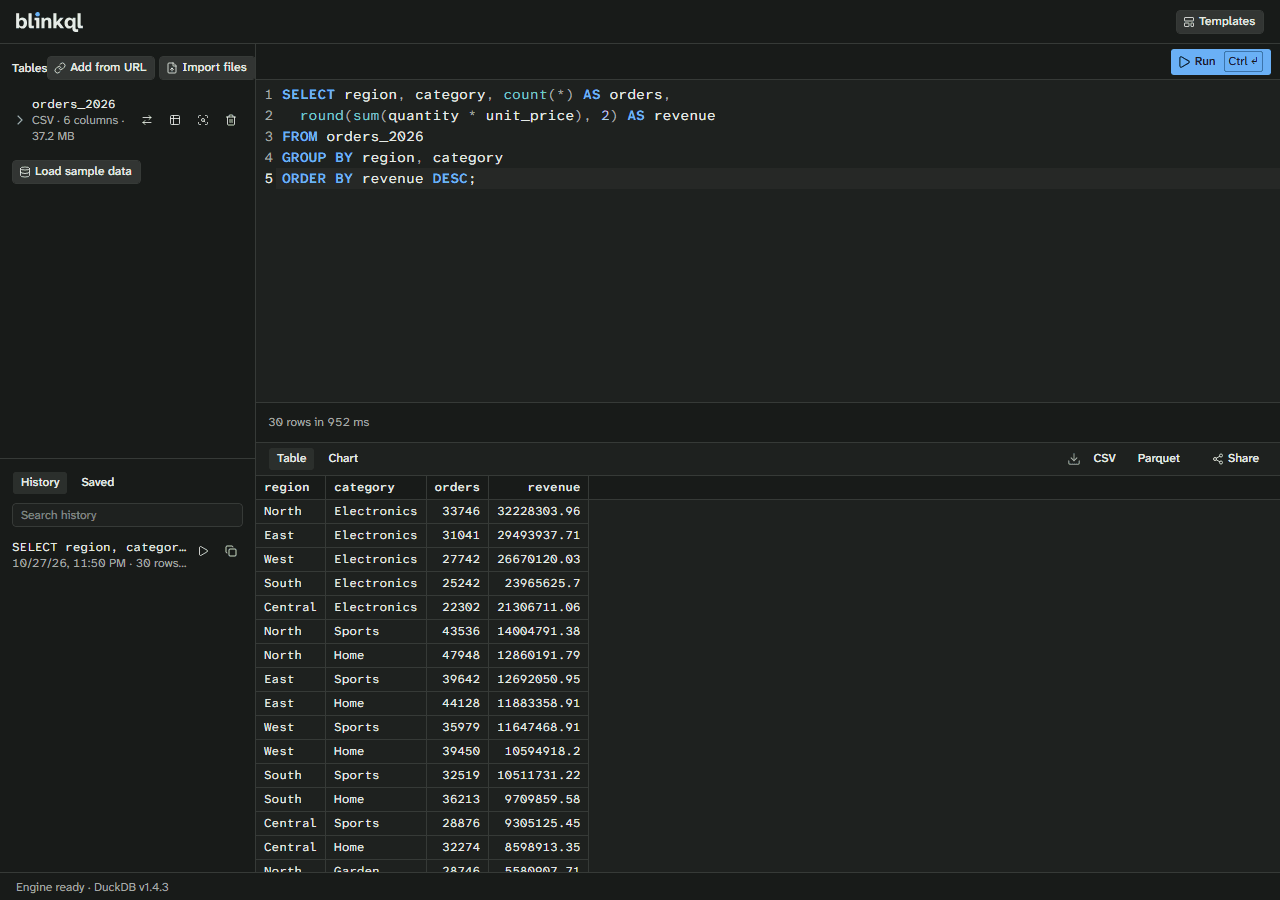
- Shipped the workbench around the engine: schema-aware SQL autocomplete, one-click data profiling, charts with downsampling done in SQL, remote Parquet over HTTP range requests, files kept in the browser’s private storage between visits, exports, and offline support.
Outcome
On the reference laptop (an Intel Core i5-8250U), showing a 10,000-row result went from about 2.5 s for 8 columns, and 13 s for 50, to under 100 ms. A million-row file shows its first rows about 90% sooner. A query run while another is still going shows its rows about 98% sooner. The initial JavaScript is 40% smaller, at 185 KB gzipped, and a return visit downloads about 3 KB instead of 34 MB.
It’s early: the core workbench is in place, and shareable query links are next on the roadmap.